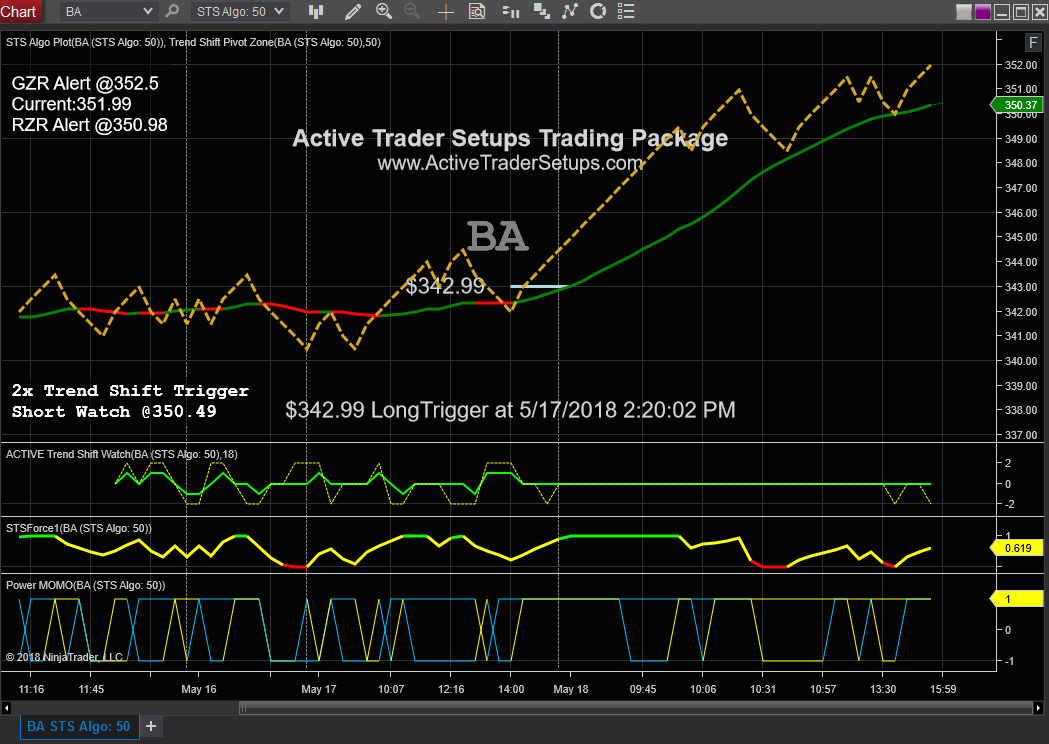

Above Chart: Proprietary Algo Chart with Real Time Projected Price Alerts on the Charts before they Trigger.

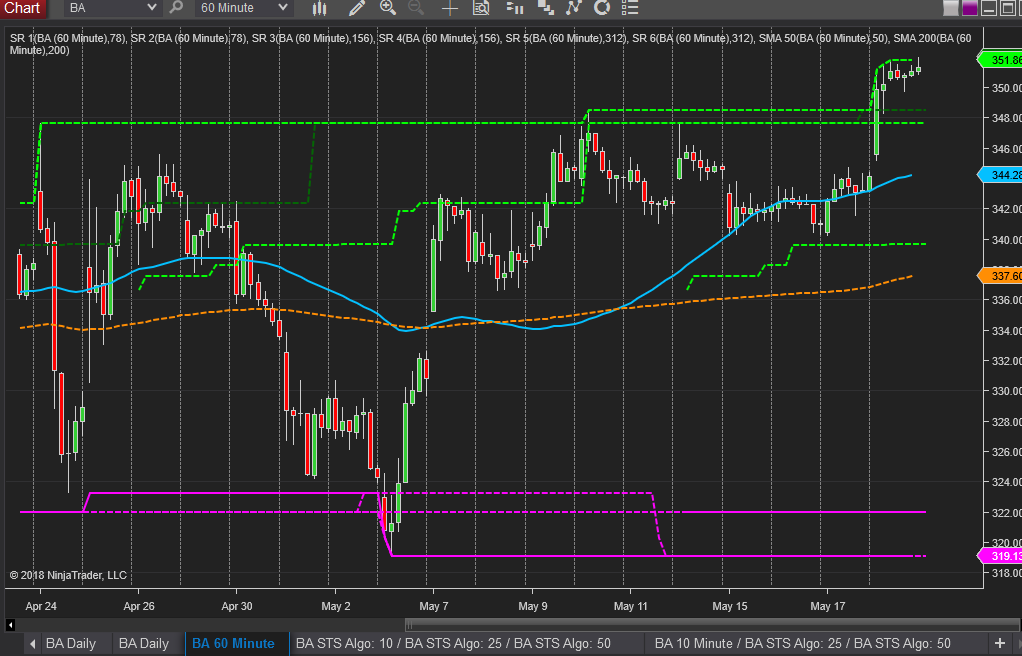
The Above Chart is a Support and Resistance chart with standard candles plotted on a 60 minute chart and plots longer term highs and lows looking back 12 to 30 days. Again the plots work on all time frames and can be changed to the traders preferences. Lower time frame charts will plot more recent support and resistance levels. Higher time frame charts will plot longer term support and resistance levels.
The longer term support and resistance plots can serve as a reference to form exit levels in Trading Plans.
This is covered in our Education and Training Webinars and Videos.
As a Subscriber to our Service and Chart Trading Setups Members acknowledge their responsibility to perform Due Diligence of stocks featured. We are not financial advisers and we perform NO Fundamental Analysis. We are only Price Action and Momentum driven in our Trading Charts and Price Alert Watch Triggers.
SPECIAL CAUTION should always be given to stocks about to have earnings releases and we recommend NOT being in a short term swing trade into a Earnings Release. At the same time using our Trading Package and Charting indicators can prepare you for the after Earnings Release Trade Setups. Subscribers also Acknowledge awareness of News and Chatter Effects on Stock Prices.
daytradersetups.com
Futures and forex trading contains substantial risk and is not for every investor. An investor could potentially lose all or more than the initial investment. Risk capital is money that can be lost without jeopardizing ones’ financial security or life style. Only risk capital should be used for trading and only those with sufficient risk capital should consider trading. Past performance is not necessarily indicative of future results. Hypothetical performance results have many inherent limitations, some of which are described below. no representation is being made that any account will or is likely to achieve profits or losses similar to those shown; in fact, there are frequently sharp differences between hypothetical performance results and the actual results subsequently achieved by any particular trading program. One of the limitations of hypothetical performance results is that they are generally prepared with the benefit of hindsight. In addition, hypothetical trading does not involve financial risk, and no hypothetical trading record can completely account for the impact of financial risk of actual trading. for example, the ability to withstand losses or to adhere to a particular trading program in spite of trading losses are material points which can also adversely affect actual trading results. There are numerous other factors related to the markets in general or to the implementation of any specific trading program which cannot be fully accounted for in the preparation of hypothetical performance results and all which can adversely affect trading results.
CFTC RULE 4.41 – HYPOTHETICAL OR SIMULATED PERFORMANCE RESULTS HAVE CERTAIN LIMITATIONS. UNLIKE AN ACTUAL PERFORMANCE RECORD, SIMULATED RESULTS DO NOT REPRESENT ACTUAL TRADING. ALSO, SINCE THE TRADES HAVE NOT BEEN EXECUTED, THE RESULTS MAY HAVE UNDER-OR-OVER COMPENSATED FOR THE IMPACT, IF ANY, OF CERTAIN MARKET FACTORS, SUCH AS LACK OF LIQUIDITY. SIMULATED TRADING PROGRAMS IN GENERAL ARE ALSO SUBJECT TO THE FACT THAT THEY ARE DESIGNED WITH THE BENEFIT OF HINDSIGHT. NO REPRESENTATION IS BEING MADE THAT ANY ACCOUNT WILL OR IS LIKELY TO ACHIEVE PROFIT OR LOSSES SIMILAR TO THOSE SHOWN.